Lucia MFISH
On demand
Lucia MFISH
Software package for Multicolor FISH. MFISH Method:
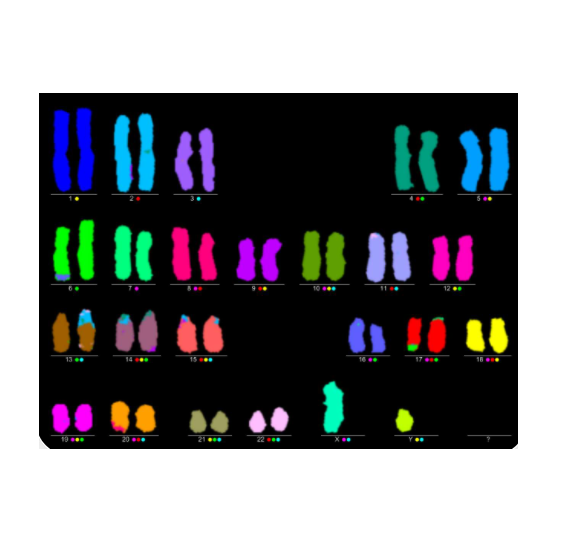
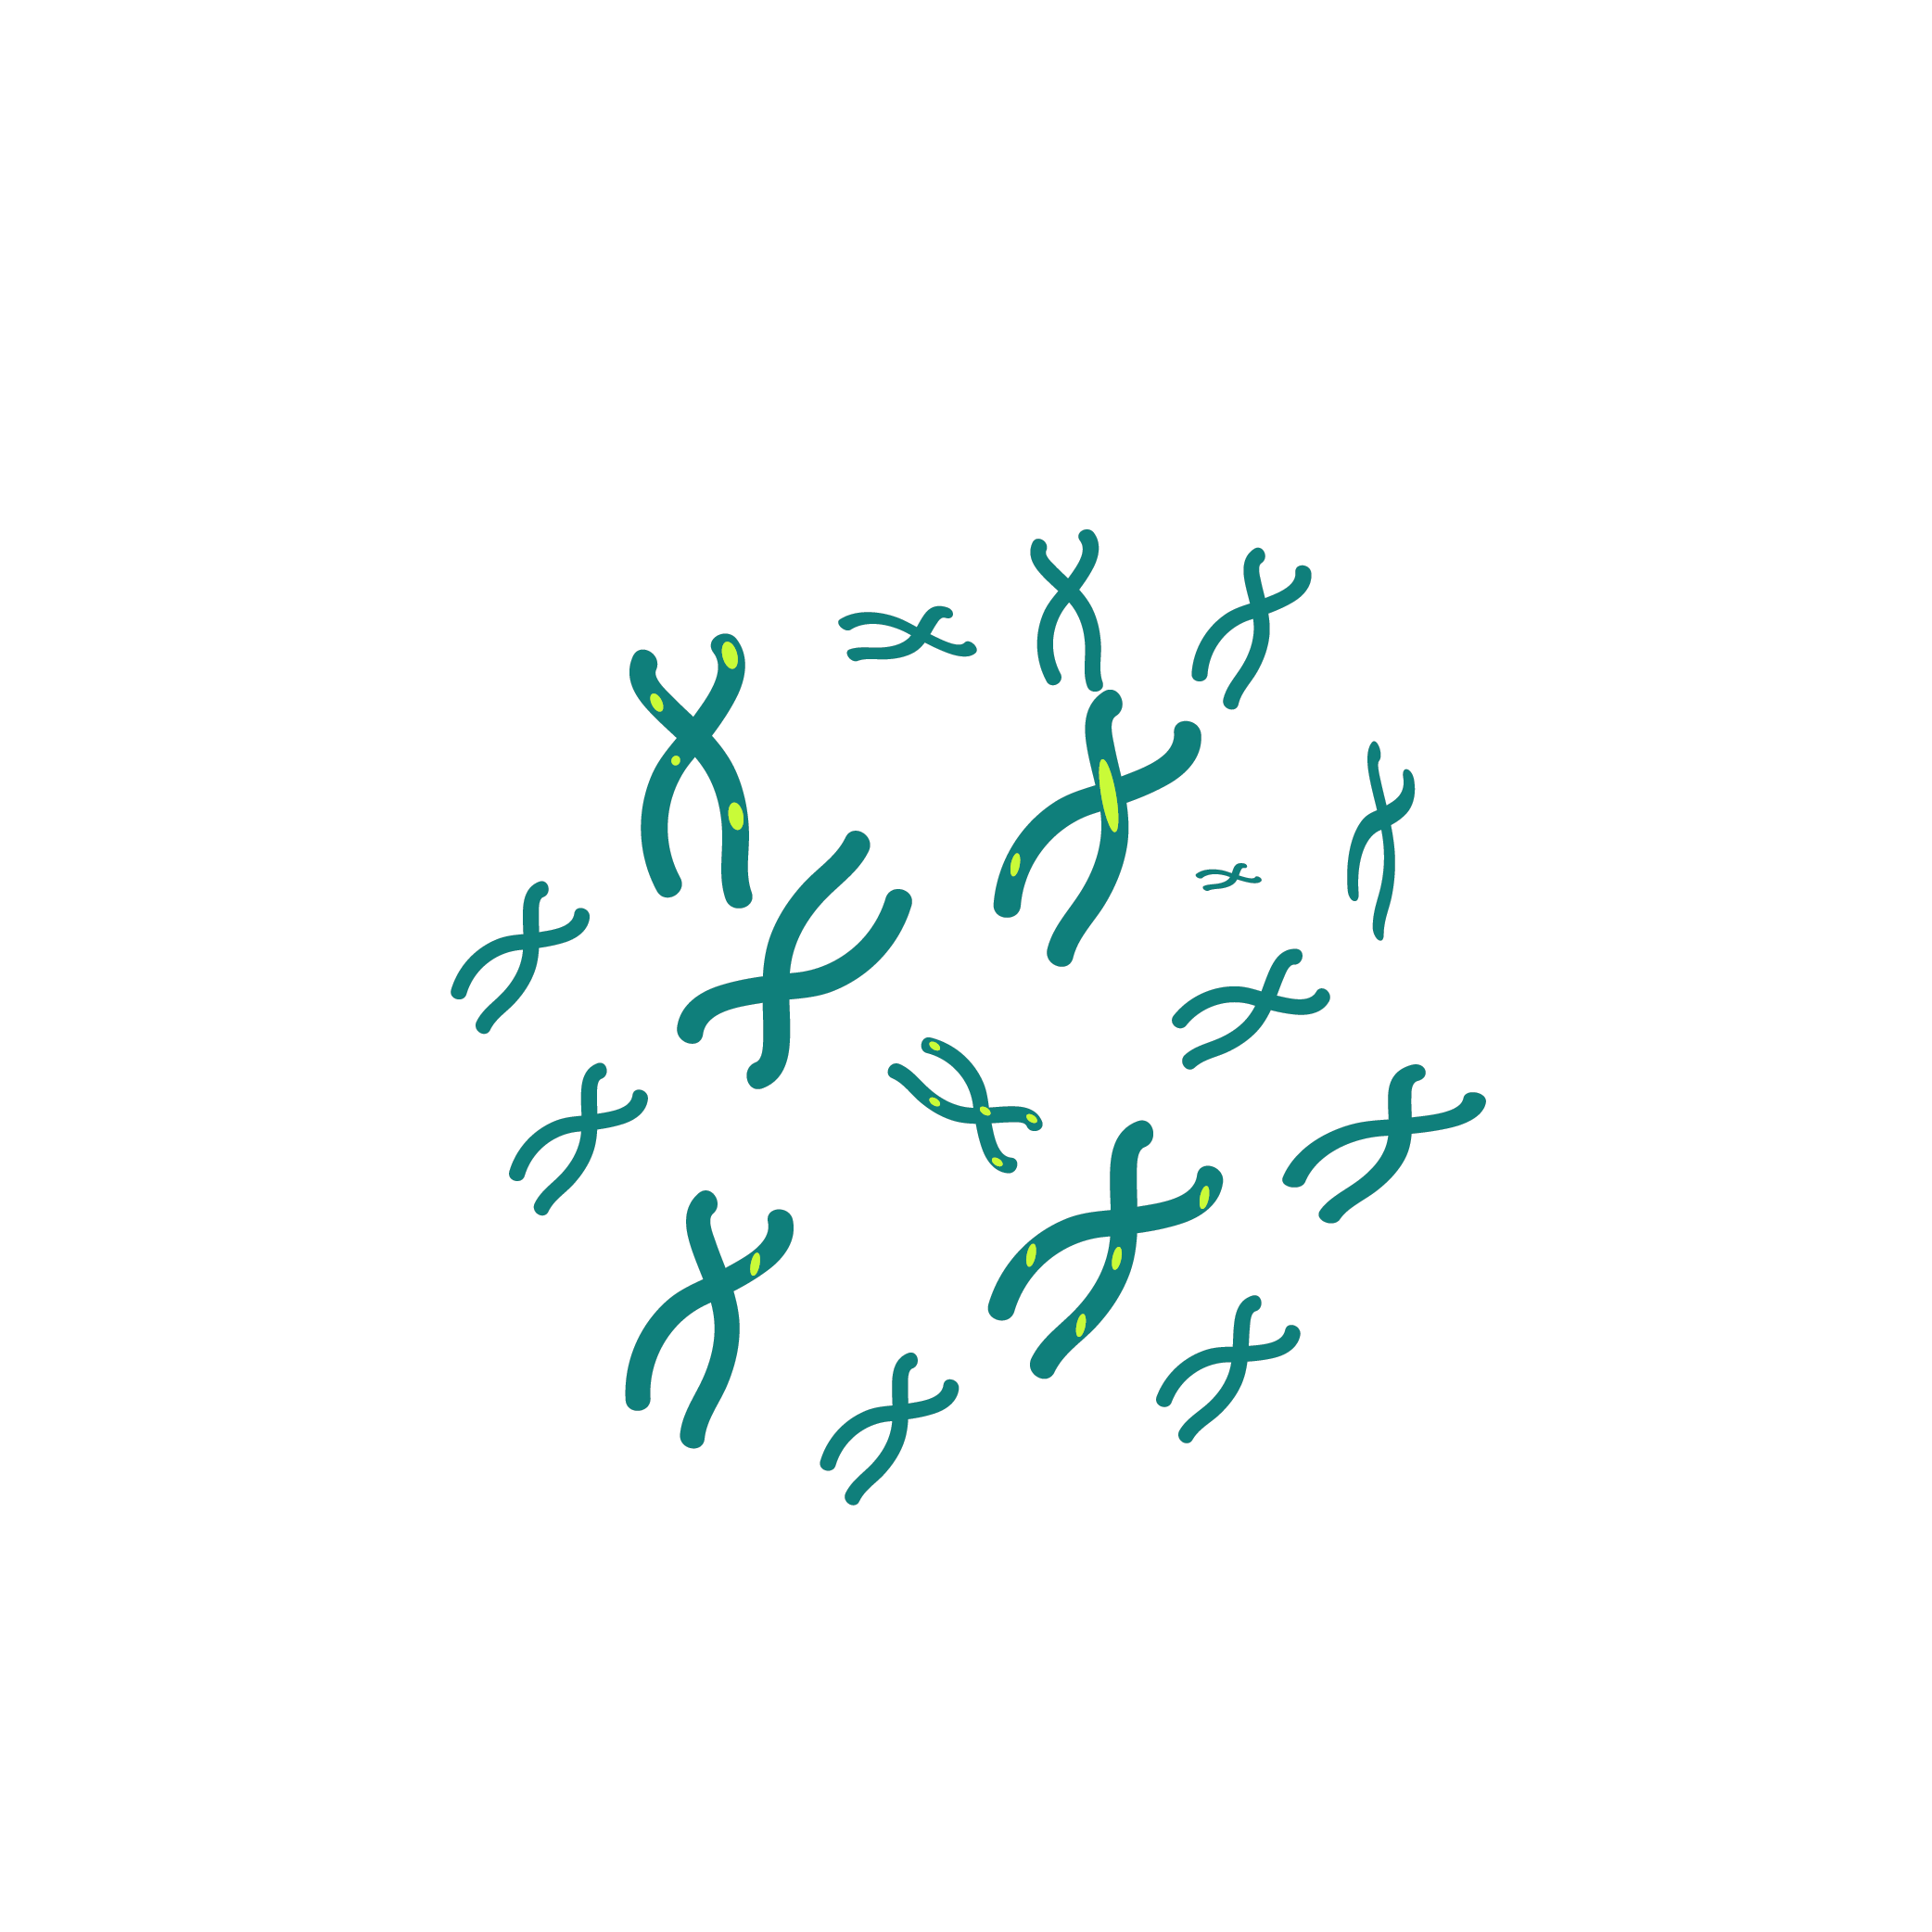
When applying MFISH (multiplex fluorescence in situ hybridization), images of chromosomes marked with 5 different fluorophores are captured separately using optical filters. LUCIA Cytogenetics then combines these images into one, in which each chromosome is assigned a distinct color based on the composition of the fluorophore.
MFISH complements the standard cytogenetic methods. It is very helpful in deciphering complex chromosomal rearrangements. It is used to identify non-random structural chromosome rearrangements not detectable by other methods.
MFISH allows rapid identification of simple and complex chromosomal alterations in metaphase spreads which may be associated with a disease initiation and progression. Therefore the applications of MFISH imaging are spreading fast - particularly in the field of cancer research.
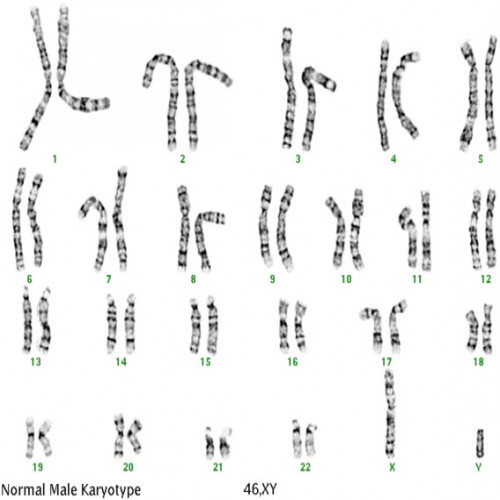
Since M-FISH (24-color FISH) is based on chromosome painting it can only be applied to metaphases.
Using the program LUCIA Cytogenetics it is possible to display the entire genome in colors using the MFISH method.
LUCIA Cytogenetics can work with fluorescent probe kits from different manufacturers.
Features
- Fast and Easy Image Acquisition:
Get high-quality images with scientific digital CCD cameras with 14bits analog-to-digital conversion.
The automatic camera exposure control ensures that maximum information is transferred to the computer, no detail gets lost.
The complete control over a motorized microscope speeds up the image acquisition and reduces the risk of human-caused errors.
Predefined acquisition settings for various probe kits
- See All Details in Full Spectrum:
See any combination of the individual color images composed into one.
See the rearrangements in pseudo color from the acquired image to the karyogram.
Labeling scheme indicators will always help you to stay informed and understand each color stain.
- Utilize All information Using the Analysis Tools:
Automatic color classification including fast pseudo color display on the raw image.
Automatic and manual spot filtering.
Rearrangement analysis allows to quickly show only the material from the selected chromosomes and thus helps clearly reveal the rearrangement.
Profile graphs allow to study the intensity profiles for all colors.
- Integration with Other LUCIA Products:
Database
Report Tool: LUCIA Cytogenetics - Report Tool including all CGH display options and CGH summary graphs.
There are no specifications
There are no report
You May Also Like

Applied Biosystems™ GeneMapper™ Software v4.1, Single Full Installation License
$ On demand
On demand


Applied Biosystems™ GeneMapper™ Software 5, client installation, 5 Licenses
$ On demand
On demand


Ion Torrent™ Partek™ Flow™ Lab Edition Software, 12 Month License (Academic)
$ On demand